Earth Observation · 2026-07-09
A Super Typhoon Just Hit Guam. From 800 km Up, It Looks Like a Spiral Galaxy. It's 2026's Third Category 5 Storm — and Peak Season Hasn't Even Started.
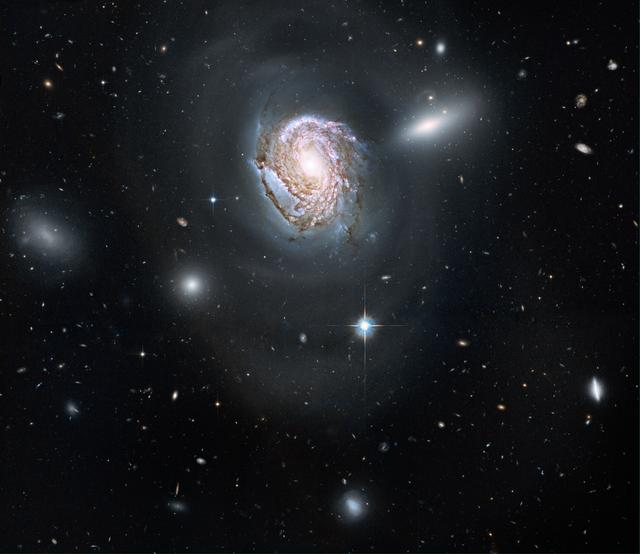
A perfect spiral is churning over the Western Pacific right now. It stretches nearly 800 kilometers across. The eye is so clear that from orbit, you can see the ocean through it.
Super Typhoon Bavi crossed the U.S. Northern Mariana Islands and Guam this morning at Category 5 intensity. NASA confirmed it.
It's July 9th. It's the third Category 5 storm of the year. Peak typhoon season doesn't even begin until August.
What Category 5 Actually Feels Like
When a meteorologist says "Category 5," they mean sustained winds above 157 mph — fast enough to strip a reinforced concrete building to its frame. In the Western Pacific, the designation goes further: Super Typhoon means sustained winds exceeding 150 knots, roughly 277 km/h.
For comparison: the fastest bullet train ever built peaks at 603 km/h. Bavi's eye wall winds are nearly half that — except it's not a train. It's the atmosphere itself, rotating for hundreds of kilometers, for days on end, with no engine and no brakes.
Guam and the Northern Mariana Islands sat directly in Bavi's path before the system continued west toward Asia. To be clear: NASA has not linked this storm to any single cause — and it would be wrong to say one storm proves anything. But the NASA-confirmed stat that this is the third Category 5 of the year by early July is the kind of number that sits in the back of a meteorologist's mind.
What NASA's Satellites Are Seeing That You Can't
Here's the thing most people never think about: the only reason any forecast existed for Bavi was because a satellite was watching.
Before Earth-observing satellites, storms like this appeared out of the open Pacific with almost no warning. Ships vanished. Islands got hit. Nobody had any track data at all. Entire fishing fleets were lost to storms that had no name, no forecast, and no witnesses — because there was nothing above the cloud tops to see them.
Today, NASA operates a fleet of Earth-watching instruments that see Bavi in ways ground observers never could. MODIS sensors aboard the Terra and Aqua satellites capture high-resolution optical imagery — those iconic spiral photos you've seen. The Global Precipitation Measurement satellite (GPM) cuts through the cloud entirely and builds a 3D map of rainfall rates inside the storm's structure in real time. It's like an MRI of a typhoon from orbit.
Then there are the geostationary satellites — parked at 35,786 km above the equator, the exact altitude where a satellite's orbital speed matches Earth's rotation. From that perch, they never move relative to the ground. They photograph the same patch of Pacific every 10 minutes, 24 hours a day, giving forecasters a continuous video of the storm's evolution. That's where typhoon track forecasts come from.
You can see which Earth-observation satellites are passing over the Pacific right now on SkyLens's live tracker — their ground tracks update in real time.
The Number That's Quietly Bothering People
Bavi is the third Category 5-intensity tropical cyclone of 2026 — and we're still weeks away from peak season in the Western Pacific basin, which historically runs from August through October.
That alone doesn't prove a trend. Some years produce clusters of intense storms; others produce few. Weather systems are chaotic. NASA hasn't issued a statement attributing 2026's pattern to any single cause.
However — and this is where the satellite data matters — NASA's long-running Earth observation programs do show that the proportion of tropical cyclones reaching Category 4 and 5 intensity has increased globally over the past four decades. Sea surface temperatures in the Western Pacific have been above average in 2026, providing the thermal energy that fuels rapid intensification. That's confirmed observation, not speculation.
How does Bavi's reach compare?
To be fair: the warning system has never been better. Track forecasts that were off by 500 km in the 1990s are now off by less than 100 km on average, almost entirely because of satellite data. The tragedy is that better tracking doesn't reduce the storm — it only gives people more time to make decisions about whether to leave.
How We Got Here: A Brief History of Seeing Storms From Space
Typhoons in the Western Pacific arrived without warning. Merchant ships and military vessels reported storms only after encountering them. Pacific island communities had days, not days — hours, sometimes minutes.
NASA's Applications Technology Satellite-1 gives forecasters their first continuous image of the Pacific. Typhoon track prediction changes almost overnight.
Daily high-resolution optical imagery of the full planet begins. Every tropical system on Earth gets photographed, every day.
First time scientists can see the 3D internal rainfall structure of typhoons from orbit. Intensity forecasting improves significantly.
Third Category 5 of the year crosses Guam. NASA's full Earth-observation fleet tracks it in real time. The forecast existed because something 800 km up was watching.
What Happens Next
After crossing Guam and the Northern Mariana Islands, Bavi is tracking west toward Asia — the standard recurvature path for Western Pacific typhoons. Its intensity at landfall depends on sea surface temperatures along the track and whether it encounters wind shear that could disrupt its structure.
NASA's satellites will keep watching. Every orbit, another pass. Every 10 minutes, another image from the geostationary fleet. The data feeds into the joint forecasting centers that issue warnings for coastal communities across the Philippines, China, and the East Asian coast.
It's easy to think of space as somewhere you look up toward. But for the 100 million people who live in the paths of Western Pacific typhoons, the most important thing in space right now is looking down.
Without it, Bavi would still be coming. We just wouldn't know until it arrived.
Want to understand how Earth observation satellites differ from communications satellites, or why geostationary orbit sits at exactly 35,786 km? Our guide to orbital mechanics breaks it all down.
For more stories about what satellites see when they look down at Earth — and what that data means — visit the SkyLens blog.
SkyLens editorial — live CelesTrak + NASA/JPL data (15986 objects)
Related stories