Space Science · 2026-10-16
VIIRS Nighttime Lights: How a Satellite Watched Hurricane Isaias Switch Off the Florida Panhandle — Block by Block
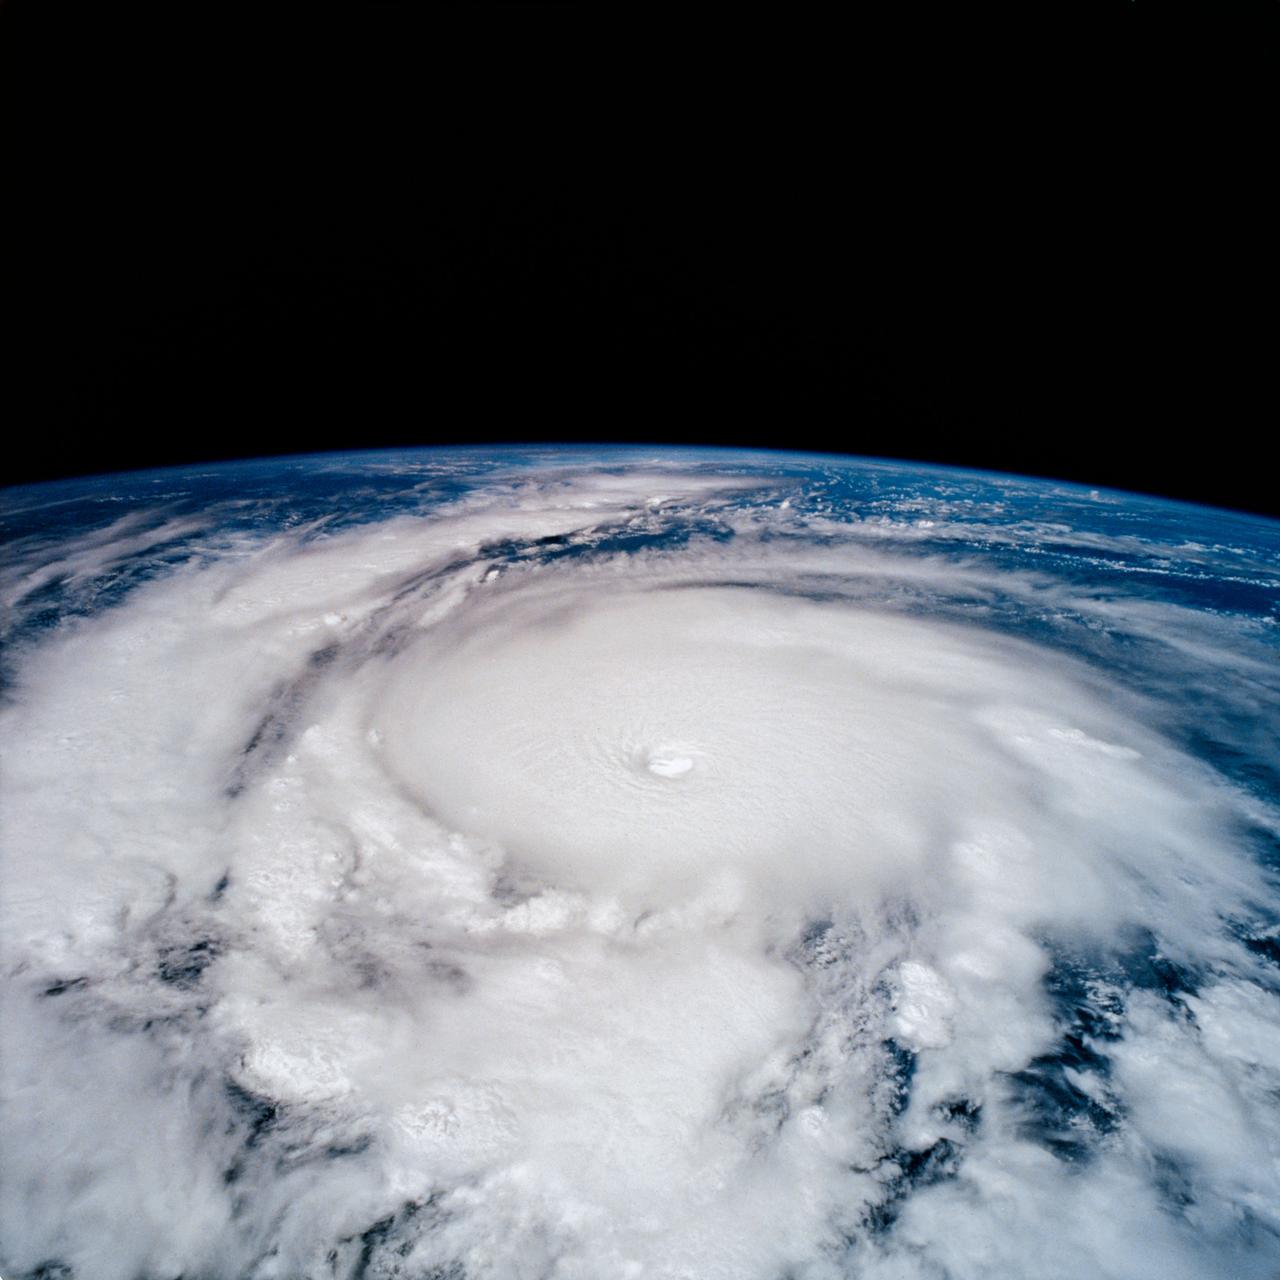
From 820 kilometres above the Gulf of Mexico, a satellite watched Hurricane Isaias do what hurricanes do. It hit the Florida Panhandle. The lights went out. Then, slowly, over hours and days, the satellite watched them come back.
That satellite wasn't chasing the storm. It wasn't tracking wind speed or rain bands. It was doing something stranger and more intimate: it was watching human civilisation in the dark.
What did VIIRS actually capture during Hurricane Isaias?
VIIRS — the Visible Infrared Imaging Radiometer Suite — captured high-definition nighttime imagery of the Florida Panhandle before, during, and after Isaias made landfall. The images showed, with unsettling clarity, exactly which neighbourhoods lost power and exactly when the lights began returning. Not region by region. Block by block.
Every night, as the Suomi NPP satellite passes overhead, VIIRS scans the entire planet once. It wasn't launched to chase hurricanes. It was built to measure clouds, sea surface temperatures, and aerosols. The nighttime light capability was almost a bonus. Then researchers realised what they actually had: a near-real-time map of where humans are, what they're doing, and — when the lights go out — what's gone wrong.
How do scientists read a power outage from space?
The method is deceptively simple. Analysts pull a "baseline" image — averaged over many calm, clear nights — and compare it pixel by pixel against the post-storm frame. The difference shows exactly how much light disappeared. Overlay that onto a population map and you can estimate, within hours of a storm making landfall, roughly how many people lost power.
No utility company reports needed. No 911 call logs. Just the raw difference between the light a coastal city emits on an ordinary Tuesday night and what it emits when a hurricane has cut the grid.
The images released via NASA's Earth Observatory tell that story without a single number. Coastal cities — bright yellow clusters on a normal night — shrink and dim. Inland communities hold power longer. Then, over the following 48–72 hours, the light returns in patches, creeping grid segment by grid segment as utility crews restore the lines.
Where else has VIIRS mapped disaster in the dark?
Isaias is the latest entry in a long, quiet record. VIIRS has been documenting humanity's fragility in the dark for more than a decade. The structure of every image is the same: a familiar coastline, then a storm, then darkness, then a slow return to light.
The entire island went dark. VIIRS showed near-total blackout within 24 hours of landfall. Recovery was the slowest in modern US disaster history — some areas stayed dark for 11 months. The satellite documented every week of it.
Analysts used VIIRS to track Russian missile strikes on the power grid in near-real-time. Towns near the front lines flickered and dimmed. The nighttime light data became simultaneously a military intelligence tool and a humanitarian planning resource.
Within 24 hours of the February earthquake, VIIRS showed which cities had lost power. Aid organisations used the maps to prioritise generator delivery before road reports were even compiled.
High-definition imagery shows the progression of the blackout and — critically — the speed of restoration. Pensacola and Panama City visible as recovering faster than smaller rural coastal communities.
Why do some cities recover faster than others — and can you see it from space?
Yes. And that's where the data gets uncomfortable.
VIIRS nighttime lights are, in effect, an economic map of the planet. Wealthy, densely populated areas shine bright. Rural, underdeveloped regions are dim. When disaster hits, recovery speed tends to follow the same gradient. Wealthier areas, with more resilient infrastructure and faster access to repair crews, come back first.
After Hurricane Maria, researchers published peer-reviewed papers using VIIRS to document the geographic inequality of Puerto Rico's recovery. The satellite hadn't made a political argument. It had just recorded the light. The politics were already in the light.
What does Earth look like from VIIRS on a clear night?
NASA's "Black Marble" dataset — the official name for the VIIRS nighttime composite — is one of the most extraordinary views our civilisation has ever produced of itself.
The United States blazes coast to coast. Europe is a continuous glow from Portugal to the Ukrainian border. India pulses with dense clusters along the Ganges and the western coast.
And then there's North Korea.
A country the size of Portugal. Twenty-five million people. Almost completely invisible at night. One satellite. One dataset. A geopolitical reality that no diplomatic briefing could communicate as clearly as a single VIIRS image.
The Amazon rainforest tells a different story: scattered pinpoints of light tracing river systems exactly, marking where communities have built along navigable waterways. From orbit, the pattern looks almost geological — until you zoom in and realise each dot is a town.
Is VIIRS being improved or replaced?
Suomi NPP launched in 2011 and was designed for a five-year life. It has now been operating for 15 years. NOAA-20 (launched 2017) and NOAA-21 (launched 2022) each carry upgraded VIIRS instruments. The Black Marble data stream has continuity now — even if the original satellite fails, the program continues.
The next leap will come from commercial satellites with far finer resolution — some operators are proposing nighttime imaging at 5 to 10 metres, fine enough to resolve individual streetlights. At that scale, you wouldn't just see a neighbourhood go dark. You'd see the block. Almost the house.
Privacy researchers are already raising the question. If you can watch a neighbourhood blackout from orbit, you can — in principle — track when individuals leave for work, take vacations, or gather in unusual numbers. The line between disaster response and surveillance is drawn by policy, not physics. The satellite doesn't know which side of the line it's on.
Hurricanes will keep hitting coastlines. The satellites will keep watching. And somewhere in the NOAA archive, every blackout and every recovery is stored frame by frame — waiting for the researcher, the aid worker, or the investigative journalist who needs to understand exactly what happened, and how long it took for the lights to come back.
Open the SkyLens live tracker to see the Suomi NPP and NOAA-20 satellites in orbit right now. Tonight, as they pass over the Florida Panhandle, they're collecting the data that will tell us how fast Isaias's lights are returning. Or browse more stories on the SkyLens blog for the bigger picture.
SkyLens editorial — live CelesTrak + NASA/JPL data (15968 objects)
Related stories